1stSTAT e-dataFunction

 Needailyweb >> NEWS


add321.com

1ststat.com


How and Why...Statistics    

>>Download

>>Download

This PDF version is copyright © 2020 by Charles C. X.      Copyrights ©   All rights reserved.   
  How and Why...Statistics

by Charles Cheng Xia,  MD. MPH.

The PDF version of this book, 167 pages of A4 size,  for online download is available. 

Save a lot! >>Download...

1stStat.com ebook reader for students.

This book is focus on description of data and analysis of data with help you understand and learn exactly what you need to know about statistical ideas and techniques, fundamental formulas and calculations and statistical core topics in scope of applications. 

The book includes more than forty examples in explanation and/or illustration, step by step, to let you understand or have ideas to understand on how and why the statistic formula and calculation be applied.

About the Author

Charles Cheng Xia is a statistics and health educator with his Medical Doctor and Master of Public Health degree. His primary research interest lies in epidemiology, health economics and complex disease dynamics inferred from data science and mathematical modeling.

 Email: xc7788@gmail.com 

Introduction


Statistics is the bridge between the data you have and the insight you need. The scope ranges from simple summaries and exploratory analyses to complex modeling and hypothesis testing.

Summary Statistics

Summary statistics provide a snapshot of a system without attempting to explain what's going on behind the scenes or to predict how things might change. Presented as tables or simple plots, these give you an overview of the information contained within your data. Summary statistics are ideal when you simply need to record and report on the data you collected, whether it's a laboratory experiment or a nationwide survey.

Exploratory Data Analysis

Often a precursor to more detailed statistical analysis and modeling, but still a very valuable exercise. The book begins to explore the relationships between the variables within the data set, to identify patterns and trends that help you understand what's going on.

Assumptions will be tested to understand what sorts of processes might be involved in generating your data. Sophisticated visualization techniques are used to display complex relationships in an easily-digestible manner to help you communicate the results and understand in simple terms what's going on.
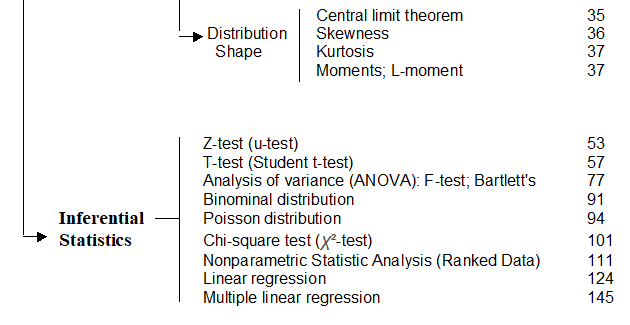
Statistical Analysis

Statistical analyses range from hypothesis tests to predictive models. They are used to answer specific questions, either about what's happening now or what might happen in the future. They provide a detailed insight into your data to create clear conclusions and motivate intelligent decisions.


This book is focus on description of data and analysis of data with help you understand and learn exactly what you need to know about statistical ideas and techniques, fundamental formulas and calculations and statistical core topics in scope of applications. The book is mainly based on the following two illustration figures to extend the statistic contents.

For your better and/or easier understanding, this book includes more than forty examples in explanation and/or illustration, step by step, to let you understand or have ideas to understand on how and why the statistic formula and calculation be applied.

It is assumed that you’ve had a basic algebra background and can do some of the basic mathematical operations and understand some of basic notation used in algebra like x, y, summation sign, taking the square root, squaring a number, and so on.

 
>>Download...

About the Author

Charles Cheng Xia is a statistics and health educator with his Medical Doctor and Master of Public Health degree. His primary research interest lies in epidemiology, health economics and complex disease dynamics inferred from data science and mathematical modeling. Email: xc7788@gmail.com 

Save a lot!

>>Download...

1Statt  
 
 e-dataFunction      Epidemiology       Public Health      Statistics         about us        Contact us              Copyrights ©   All rights reserved. 

 Our analysis service lets your data speak - delivering the information you need to make intelligent decisions.


Boundless is the sea for fish to dive at will, unlimited is the sky for birds to fly at ease.

SEARCH >>        


©