| e-df.com | e-DataFunction Solutions | websites (navigation) |
| Previous page << | epi-1 epi-2 epi-3 | statistics epi-in Chinese | e-print |

Analysis
Statistical Analysis is the bridge between the data you have and the insight you need. The scope ranges from simple summaries and exploratory analyses to complex modelling and hypothesis testing. Our analysis service lets your data speak - delivering the information you need to make intelligent decisions.
Summary Statistics
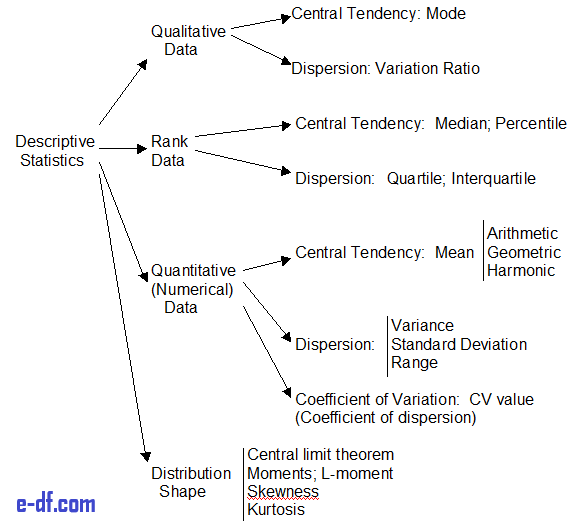
Summary statistics provide a snapshot of a system without attempting to explain whatós going on behind the scenes or to predict how things might change.
Presented as tables or simple plots, these give you an overview of the information contained within your data. Summary statistics are ideal when you simply need to record and report on the data you collected, whether itós a laboratory experiment or a nationwide survey.
Exploratory Data Analysis
Often a precursor to more detailed statistical analysis and modelling, but still a very valuable exercise. The EDA begins to explore the relationships between the variables within your data set, to identify patterns and trends that help you understand whatós going on.
Assumptions will be tested to understand what sorts of processes might be involved in generating your data. Sophisticated visualisation techniques are used to display complex relationships in an easily-digestible manner to help you communicate the results and understand in simple terms whatós going on.
Statistical Analysis
Statistical analyses range from hypothesis tests to predictive models. They are used to answer specific questions, either about whatós happening now or what might happen in the future. They provide a detailed insight into your data to create clear conclusions and motivate intelligent decisions.
 |
 |
 |
 |
 |
 |
| PUBLIC HEALTH (Epidemiology)
>> World Health Organization (WHO) (WHO / Homepage) >> Centers for Disease Control and Prevention (CDC), USA >> Public Health Agency of Canada >> BC Centre for Disease Control (BC, Canada) |
|
|
Excel Functions SAS List of statistical software S. Tables Others s S.Base |
![]()
![]()
|
Epidemiology
>> International Journal of Epidemiology >> Journal of Epidemiology and Community Health >> Journal of Clinical Epidemiology Biostatistics>> Canada's national statistical agency |
Case Study
Future of Epidemiology |
|
|
omega369oil.com (nutrition) |
nose-care.com (nasal allergy & rhinitis) |
|
|
|
||
| Copyrights © by EDF Solutions Inc. All rights reserved. | Contact us / 联络 | About us / 关于我们 |


